Large scale graphics:
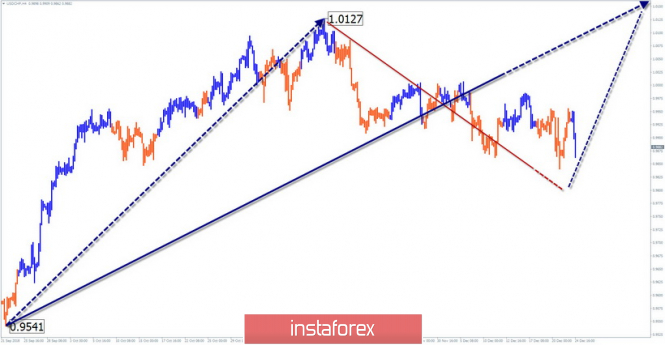
Since February of this year, the price of the franc is developing along an upward algorithm. While in the dominant direction, the last wave of the scale H4 started in September.
Medium scale graphics:
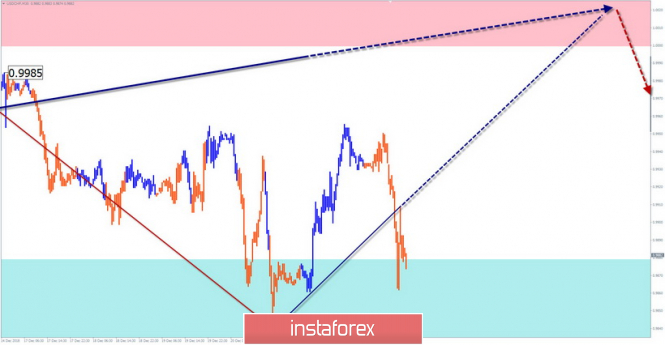
The bearish wave dated November 13, in the model of the older TF which completed the correctional construction of irregular shape. The price has reached the upper limit of the target zone.
Small scale graphics:
From December 11, a rising structure develops on the chart, which can eventually become a reversal. The current wave scale doesn't allow exceeding the level of correction.
Forecast and recommendations:
In the near weekly period, the pair 's flat mood will continue. In the framework of intersessional trade, there is an opportunity to make short-term purchases. For longer investments, a couple of conditions have not yet been created.
Resistance zones:
- 1.0000 / 1.0050
Support areas:
- 0.9870 / 0.9820
Explanations to the figures: : The simplified wave analysis uses waves consisting of 3 parts (A – B – C). For analysis, 3 consecutive graphs are used. Each of them analyzes the last, incomplete wave. More so, zones show calculated areas with the highest probability of reversal. The arrows indicate the wave marking by the method used by the author. The solid background shows the formed structure, which is the dotted - the expected movement.
Attention: The wave algorithm does not take into account the duration of tool movements over time. To conduct a trade transaction, you need confirmation signals from the trading systems you use.
The material has been provided by InstaForex Company -
www.instaforex.com