Technical market overview:
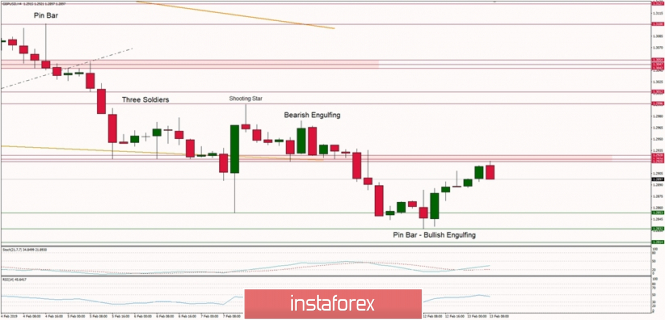
The GBP/USD pair has made an indecision candlestick pattern with a low at the level of 1.2832 and then the price has bounced towards the nearest technical resistance zone located between the levels of 1.2920 - 1.2928. The momentum remains neutral on the way up and the price seems to be reversing again, so the first technical assistance has capped the bullish attempt to rally. The question remains whether the market will continue the downtrend straight on or we will have to wait until some kind of horizontal correction completes first. So far, the first option is more probable.
Weekly Pivot Points:
WR3 - 1.3314
WR2 - 1.3207
WR1 - 1.3066
Weekly Pivot - 1.2955
WS1 - 1.2817
WS2 - 1.2712
WS3 - 1.2570
Trading recommendations:
Day traders should try to open sell orders again as close as possible to the level of 1.2920 with a protective SL just above the level of 1.2929. The target is seen at the levels of 1.2860 and 1.2853. Please notice that currently, this is not the best level to open long-term sell orders as the corrective bounce might be still developing.
The material has been provided by InstaForex Company -
www.instaforex.com