Bitcoin continues to trade inside the long-term sideways triangle pattern that has been formed since February. Traders should be patient and not try and front run the market. Traders should wait for the triangle boundaries to break before taking action.
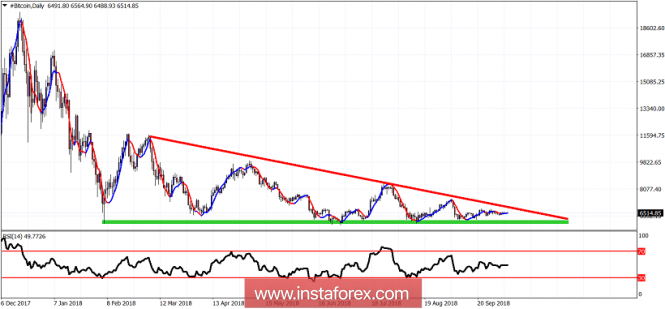
Red line - resistance trend line
Green rectangle - support
Bitcoin has reached more than 5 times the support area between 6,000$ and 5,700$. Each time support was respected but the following bounce was weaker. This resulted in a series of lower highs and the creation of the red downward sloping resistance trend line. Resistance is now at 6,850$. If Bitcoin breaks the triangle to the upside we should expect a move to reach 10,000-12,000$. If price breaks support we should expect Bitcoin to move towards 500$.
The material has been provided by InstaForex Company -
www.instaforex.com