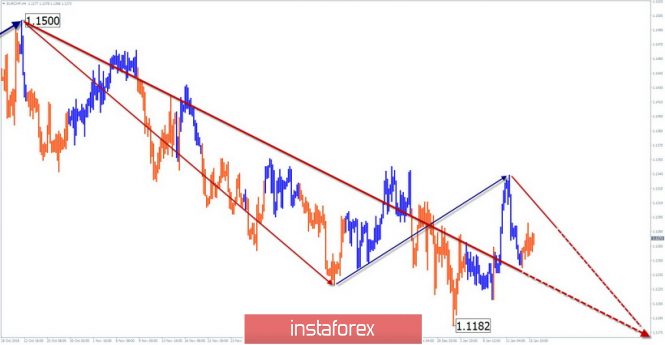
Large scale graphics:
At the end of the downtrend since the beginning of September last year, a bullish wave pattern has been formed, which has a reversal potential. The wave has the wrong appearance of its structure. From the end of October, the middle part of the wave (B) is formed.
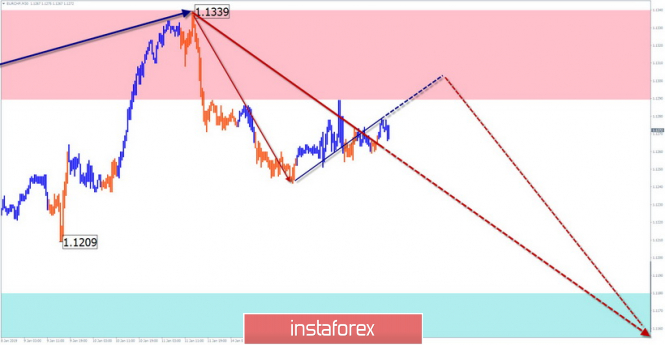
Medium scale graphics:
From December 11, a bullish correction (B) has formed within the bearish wave of the TF H4. It has the shape of a sliding plane. Today, there are all signs of completion of the model.
Small scale graphics:
The price decline that began on January 11 gave rise to a bearish wave of a larger scale. More so, the decline will continue after completion of the rollback up.
Forecast and recommendations:
The upcoming price reduction will be temporary. Taking advantage of this can only come from the supporters of trade intraday. Longer investments will be possible after the completion of the entire current decline.
Resistance zones:
- 1.1290 / 1.1340
Support areas:
- 1.1180 / 1.1130
Explanations to the figures: The simplified wave analysis uses waves consisting of 3 parts (A – B – C). For analysis, 3 consecutive graphs are used. Each of them analyzes the last, incomplete wave. Zones show calculated areas with the highest probability of reversal. The arrows indicate the wave marking by the method used by the author. The solid background shows the formed structure, the dotted - the expected movement.
Note: The wave algorithm does not take into account the duration of tool movements over time. To conduct a trade transaction, you need confirmation signals from the trading systems you use.
The material has been provided by InstaForex Company -
www.instaforex.com