Overview:
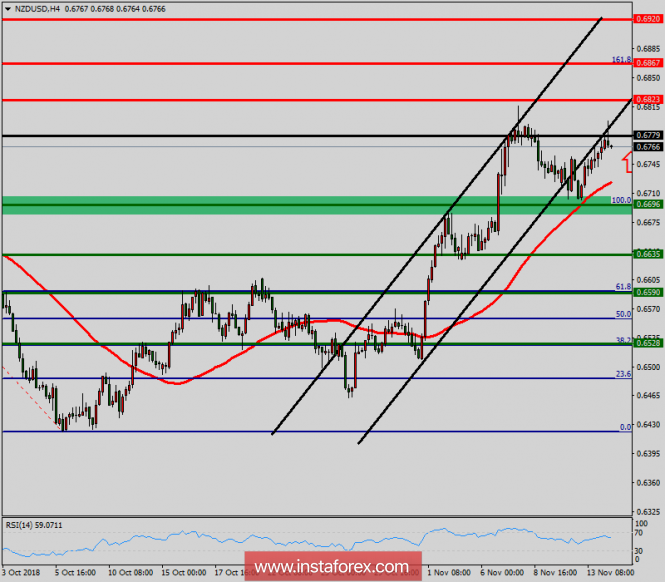
Pivot: 0.6779.
The NZD/USD pair continues to move upwards from the level of 0.6696. The pair rose from the level of 0.6696 to a top around 0.6779. Today, the first resistance level is seen at 0.6823 followed by 0.6867, while the daily support 1 is seen at 0.6696 (last bearish wave). According to the previous events, the NZD/USD pair is still moving between the levels of 0.6779 and 0.6867; so we expect a range of 88 pips. Furthermore, if the trend is able to break out through the first resistance level at 0.6779, we should see the pair climbing towards the resistance of 0.6823 to test it. Therefore, buy above the level of 0.6779 with the first target at 0.6823 in order to test the daily resistance 1 and further to 0.6867. Also, it might be noted that the level of 0.6867 is a good place to take profit because it will form a double top. On the other hand, in case a reversal takes place and the NZD/USD pair breaks through the support level of 0.6696, a further decline to 0.9789 can occur which would indicate a bearish market on the H4 chart.
The material has been provided by InstaForex Company -
www.instaforex.com