Gold prices remains below resistance at $1,210 and inside the bearish channel. I believe the most probable outcome will be a break below $1,200-$1,195 short-term support for a move to new lows. Gold's bounce from August lows looks more corrective than impulsive.
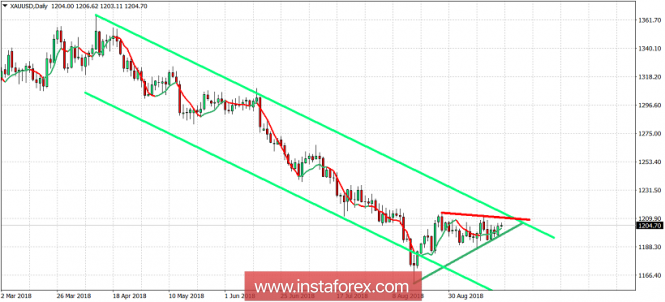
Green lines - bearish channel
Red line - short-term resistance
Dark green line - short-term support
Short-term resistance is at $1,210 and short-term support at $1,200-$1,198. Price has bounced off August lows but is mainly moving sideways after topping at the end of August. A break above $1,210 will be a very positive sign and could push prices higher towards $1,220-30 area where the next longer-term resistance is found. On the other hand if prices break below the short-term support, we should expect to test $1,180. If this level is broken, I expect Gold to move lower towards $1,140.
The material has been provided by InstaForex Company -
www.instaforex.com