Gold price made a higher low yesterday relative to the $1,180 low made last week. Price is now challenging the short-term bearish channel upper boundary. Breaking above $1,195 would be a bullish sign. However, bulls have lots of work to do as price remains inside the long-term bearish channel.
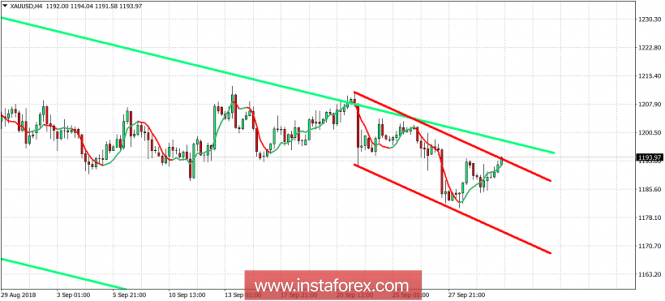
Red lines - short-term bearish channel
Green lines - long-term bearish channel
Gold price is trying to start a sequence of higher highs and higher lows. Resistance is here at $1,193-95 and next at $1,197-$1,200. Support is at $1,184. Breaking below $1,184 will open the way for a move towards $1,177-73. If bulls manage to break above the $1,200 level, we could see a sharp move towards $1,220.
The material has been provided by InstaForex Company -
www.instaforex.com