The strong Dollar is not good for gold as prices have broken below the 61.8% Fibonacci retracement. Price is forming a bullish wedge and bulls continue to hope for a sharp reversal upwards as long as price is above the $1,212 lows.
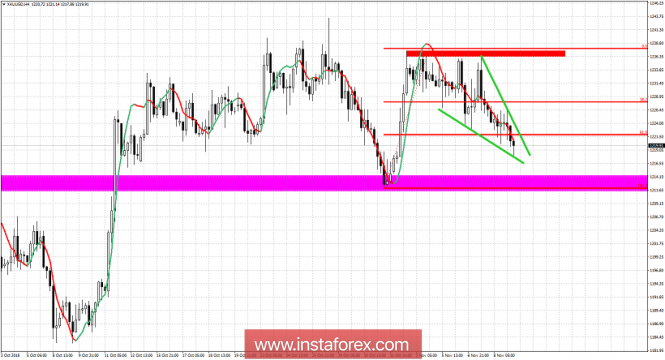
Magenta rectangle - support
Green lines - bullish wedge pattern
Red rectangle - resistance area
Gold price has broken the 61.8% Fibonacci retracement. This is not a bullish sign. Bulls' last line of defense is the support area around $1,212. Resistance is at $1,223-24. Breaking above this level will most probably push gold back towards $1,235-40. Only a break above $1,240 could push gold towards our 2nd longer-term target of $1,260. Breaking below $1,212 could push gold price even below $1,200 or even to new yearly lows. So breaking this low would make me change my bullish view.
The material has been provided by InstaForex Company -
www.instaforex.com