Overview:
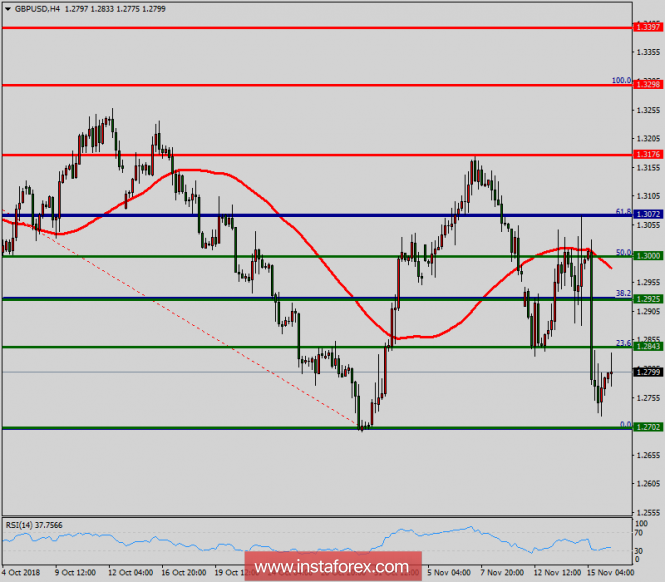
Pivot point: 1.3072.
The GBP/USD pair broke resistance, which turned into strong support at 1.2925. Right now, the pair is trading above this level. It is likely to trade in a higher range as long as it remains above the support (1.2925), which is expected to act as a major support today. Therefore, there is a possibility that the GBP/USD pair will move upwards and the structure does not look corrective. The trend is still below the 100 EMA, so the bullish outlook remains the same as long as the 100 EMA is headed to the upside. From this point of view, the first resistance level is seen at 1.3072 followed by 1.3176, while daily support 1 is seen at 1.3000 (50% Fibonacci retracement). According to the previous events, the GBP/USD pair is still moving between the levels of 1.3000 and 1.3176; so we expect a range of 176 pips. Consequently, buy above the level of 1.3000 with the first target at 1.3072 so as to test the daily resistance 1 and further to 1.3176. Besides, the level of 1.3176 is a good place to take profit because it will form a double top. On the contrary, in case a reversal takes place and the GBP/USD pair breaks through the support level of 1.3000, a further decline to 1.2925 can occur, which would indicate a bearish market. Overall, we still prefer the bullish scenario, which suggests that the pair will stay below the zone of 1.2840.
The material has been provided by InstaForex Company -
www.instaforex.com