Gold price has broken below $1,220 and has moved lower towards the break out area of $1,215-13. Price back tested this support level and bounced. This is a bullish sign. Gold bulls do not want to see prices break below yesterday lows. They want now to see higher highs and higher lows.
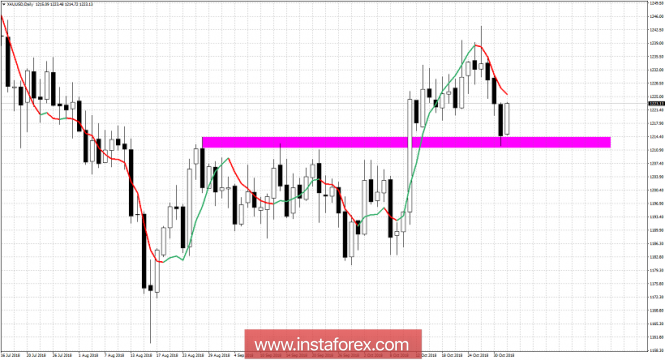
Magenta rectangle - previous resistance now support area
Gold price is bouncing back above $1,220. This is a very bullish sign. Bulls need to hold above the support area and steadily start a new upward move with higher highs and higher lows. Next resistance for Gold is at $1,223.50 and next at $1,234. A four hour candle close above $1,234 would be a very bullish sign. On the other hand bulls do not want to see price break below $1,212. This would imply that the entire bounce from August lows is most probably over. Bulls do not want to see price make lower lows and lower highs.
The material has been provided by InstaForex Company -
www.instaforex.com