The wave pattern of the H4 graph:
Since March 23, we can state a change in trends on Japanese yen major pair on the chart. The wave has a very high level and will eventually become the first part of the larger-scale upward movement of the pair.
The wave pattern of the H1 graph:
The bearish wave of July 19 forms the middle part of the movement in the highest wave. Quotations of the pair approach the beginning of the final phase of the movement (C).
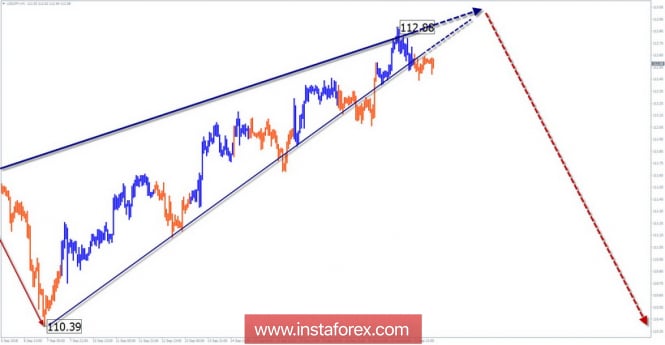
The wave pattern of the M15 chart:
The ascending section of August 21 is nearing completion. In a larger watch model, it takes the place of correction. The price has reached the lower boundary of the resistance zone of large scale.
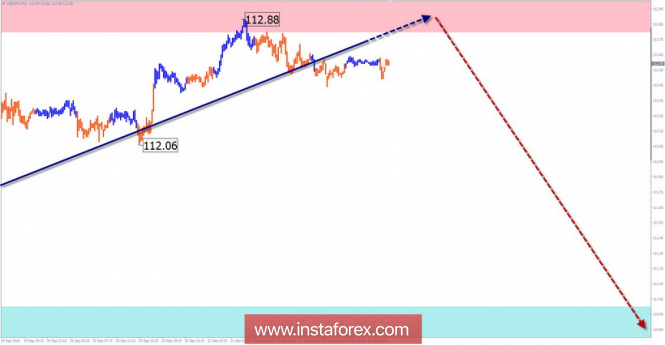
Recommended trading strategy:
In the coming weeks, a more promising direction will be a price move down. It is recommended to track the sell signals of the instrument. Investors wisely wait out the corrective phase of the market.
Resistance zones:
- 112.80 / 113.30
Support zones:
- 111.00 / 110.50
Explanations to the figures:
A simplified wave analysis uses a simple waveform, in the form of a 3-part zigzag (ABC). The last incomplete wave for every time frame is analyzed. Zones show the calculated areas with the greatest probability of a turn.
Arrows indicate the counting of wave according to the technique used by the author. The solid background shows the generated structure and the dotted exhibits the expected wave motion.
Attention: The wave algorithm does not take into account the duration of the tool movements in time. To conduct a trade transaction, you need to confirm the signals used by your trading systems.
The material has been provided by InstaForex Company -
www.instaforex.com