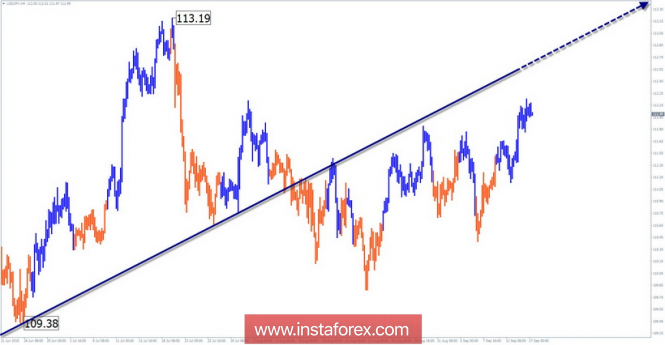
The wave pattern of the H4 chart:
The last section of this scale from May 29 enters the structure of the dominant trend wave. The price is at the bottom edge of a wide zone of resistance.
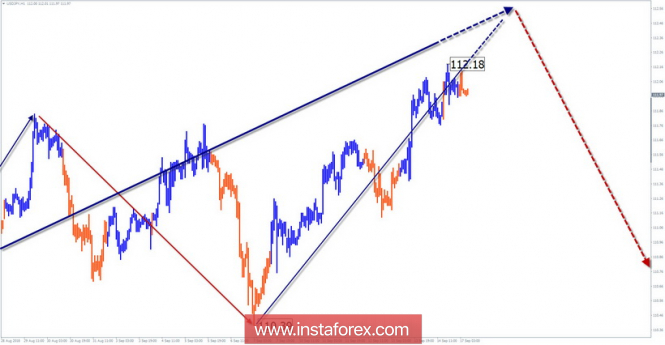
The wave pattern of the H1 chart:
Since July 19, a bearish wave zigzag is forming downward. In the daytime wave, it will become a correction (B).
The wave pattern of the M15 chart:
The rising wave of August 21 overcame the level of minimum elongation. The next level is within the target zone.
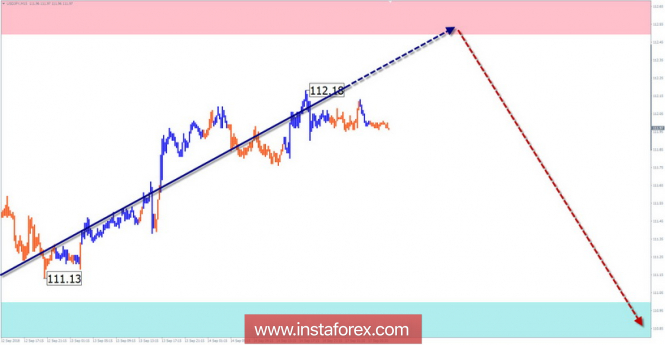
Recommended trading strategy:
Purchases are risky, possible within the framework of intraday trading. In the area of the settlement resistance zone, traders are encouraged to keep track of reversal signals for the sale of the pair.
Resistance zones:
- 112.50 / 113.00
Support zones:
- 111.00 / 110.50
Explanations to the figures:
A simplified wave analysis uses a simple waveform, in the form of a 3-part zigzag (ABC). The last incomplete wave for every timeframe is analyzed. Zones show the calculated areas with the greatest probability of a turn.
Arrows indicate the counting of wave according to the technique used by the author. The solid background shows the generated structure and the dotted exhibits the expected wave motion.
Attention: The wave algorithm does not take into account the duration of the tool movements in time. To conduct a trade transaction, you need to confirm the signals used by your trading systems.
The material has been provided by InstaForex Company -
www.instaforex.com