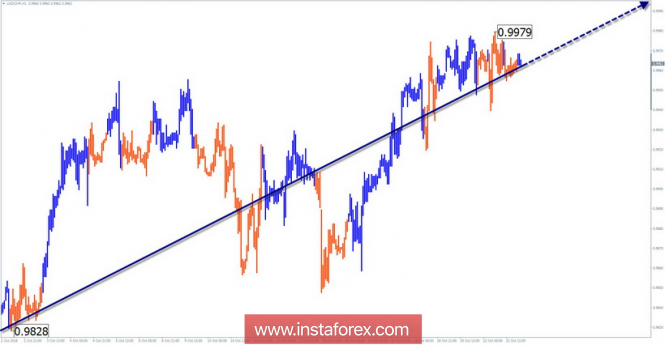
Wave pattern graphics H4:
The last wave of this scale took the place of a downward correction in the bullish wave D1.
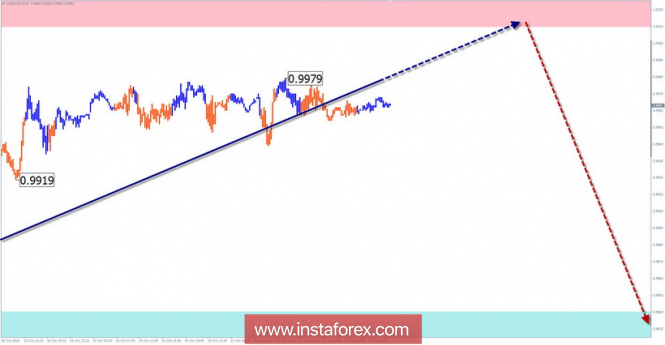
Wave pattern graphics H1:
The high wave level of the price rise that began on September 21 indicates its potential transition to a larger scale of movement.
Wave pattern graphics M15:
The rising wave from October 15 completes the watch wave model. In the next week, you can wait for the price correction.
Recommended trading strategy:
Until the end of this month, the course of the pair will be mainly in the "outset". Short-term sales make sense to use only in intraday trading.
Resistance zones:
- 1.0010 / 1.0060
Support areas:
- 0.9840 / 0.9790
Explanations for the figures: The simplified wave analysis uses waves consisting of 3 parts (A – B – C). For the analysis, 3 main TFs are used, on each, the last, incomplete wave is analyzed. Zones show calculated areas with the highest probability of reversal.
The arrows indicate the wave marking by the method used by the author. The solid background shows the formed structure, the dotted - the expected movement.
Note: The wave algorithm does not take into account the duration of tool movements over time. To conduct a trade transaction, you need confirmation signals from the trading systems you use!
The material has been provided by InstaForex Company -
www.instaforex.com