The wave pattern of the H4 graph:
The descending wave of the major pound from April 17 achieved the upper limit of the powerful zone of support for a higher timeframe. The wave structure looks formed.
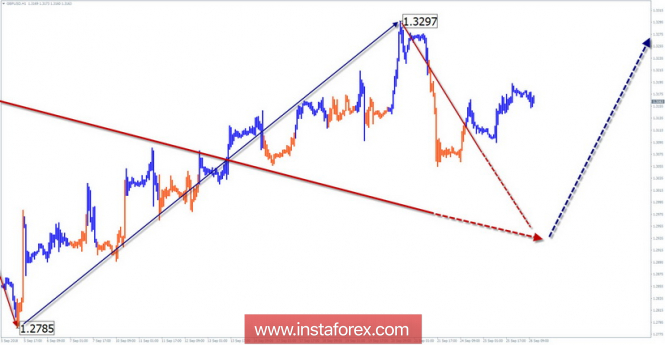
The wave pattern of the H1 graph:
The potential of the rising wave from August 15 allows us to classify it as a reversal structure. In the previous month, a completely hidden correction developed within the movement.
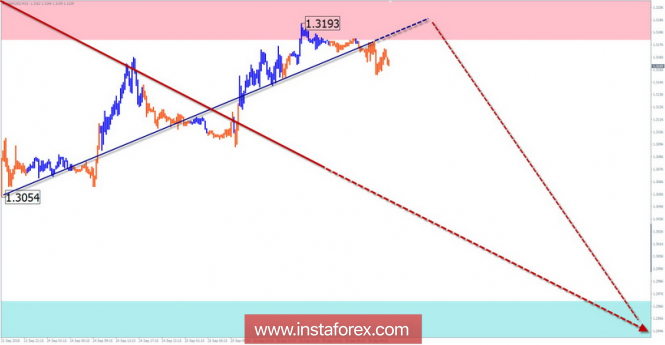
The wave pattern of the M15 chart:
The bear plot of the schedule from September 20 completes the correctional model of the hourly timeframe, reaching the price level of the minimum possible elongation. Full completion is expected in the settlement of the support area.
Recommended trading strategy:
Purchases of the pair remain in priority. In the coming days, the price will experience strong volatility, this period is better to avoid. Within the intraday, short sales are possible.
Resistance zones:
- 1.3180 / 1.3230
Support zones:
- 1.2970 / 1.2920
Explanations to the figures:
Explanations to the figures:
A simplified wave analysis uses a simple waveform, in the form of a 3-part zigzag (ABC). The last incomplete wave for every timeframe is analyzed. Zones show the calculated areas with the greatest probability of a turn.
Arrows indicate the counting of wave according to the technique used by the author. The solid background shows the generated structure and the dotted exhibits the expected wave motion.
Attention: The wave algorithm does not take into account the duration of the tool movements in time. To conduct a trade transaction, you need to confirm the signals used by your trading systems.
The material has been provided by InstaForex Company -
www.instaforex.com