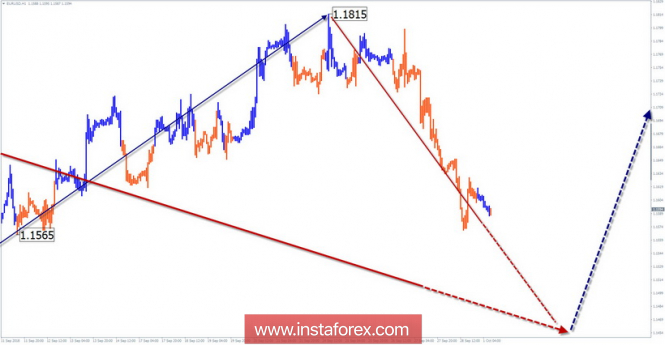
Wave pattern graphics H4:
The main trend of the euro this year looks at the "south" of the chart. A large-scale support zone has been reached.
Wave pattern graphics H1:
Since mid-August, an ascending wave structure is being formed. The wave level of motion allows you to wait for the continuation of the wave at a higher level.
Wave pattern graphics M15:
From September 21, a downward wave develops. On a larger scale chart, it completes a corrective zigzag.
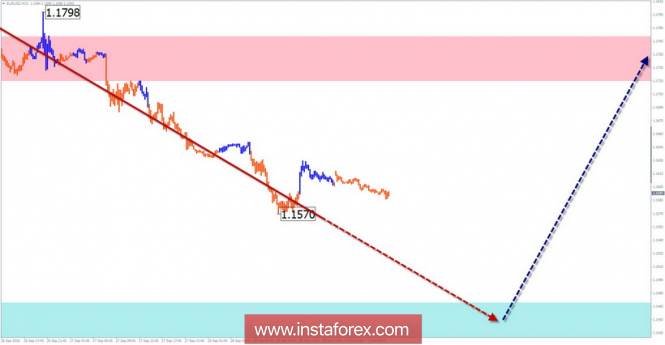
Recommended trading strategy:
The short-term sales in small lots can be used for intraday trading. For longer transactions, you need to wait for the current wave to complete and look for signals to buy the pair.
Resistance zones:
- 1.1720 / 1.1770
Support zones:
- 1.1470 / 1.1420
Explanations for the figures: The simplified wave analysis uses waves consisting of 3 parts (A – B – C). For the analysis, 3 main TFs are used, on each, the last, incomplete wave is analyzed. Zones show calculated areas with the highest probability of reversal.
The arrows indicate the wave marking by the method used by the author. The solid background shows the formed structure, the dotted - the expected movement.
Note: The wave algorithm does not take into account the duration of tool movements over time. To conduct a trade transaction, you need confirmation signals from the trading systems you use!
The material has been provided by InstaForex Company -
www.instaforex.com