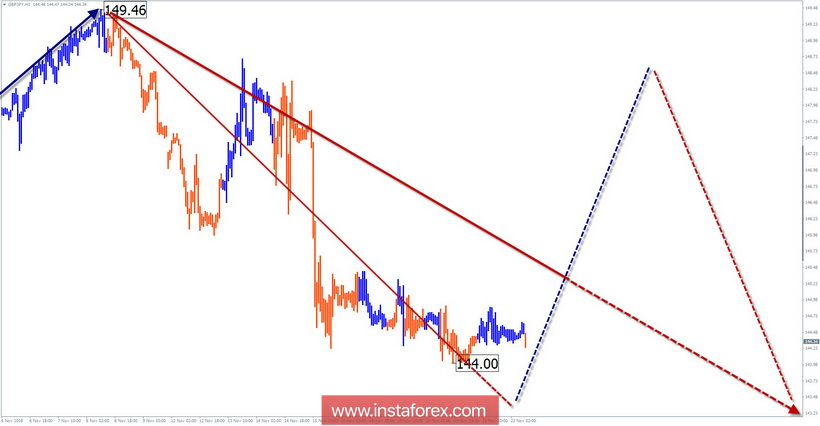
Wave pattern of H4 chart:
The last current wave of the cross starts in mid-August. To date, the structure looks complete. The price has almost reached the end of the settlement zone.
Wave pattern of H1 chart:
A downward wave has been forming since November 8. Its wave potential goes beyond the correction of the last section of the H4 trend. Soon followed by a retracement to the correction (B).
Wave pattern of the M15 chart:
The wave of November 13 completes the bearish zigzag of the hour scale. A reversal is expected as part of the settlement support.
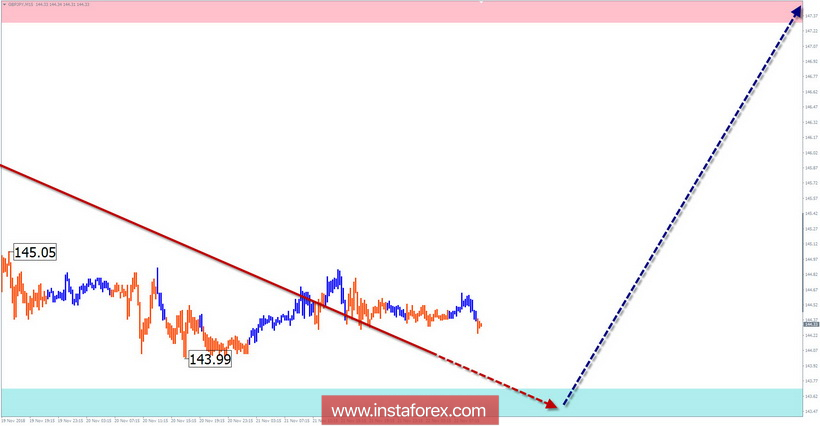
Recommended trading strategy:
In the coming week, there is a high probability of changing the direction of the intersessional trend. Buying can only be recommended as part of intraday trading. For the rest it is better to refrain from deals and wait for confirmation of the change in the direction of the short-term trend of the pair.
Resistance zone:
- 147.30/147.80
Support zone:
- 143.70/143.20
Explanation of figures: the simplified wave analysis uses waves consisting of 3 parts (A-B-C). For the analysis, 3 main TFs are used, on each the last, incomplete wave is analyzed. Zones show calculated areas with the highest probability of reversal.
The arrows indicate the wave marking by the method used by the author. The solid background shows the formed structure, the dotted - the expected movement.
Note: the wave algorithm does not take into account the duration of the tool movements over time. To conduct a trade, you need to confirm the signals of the trading systems you use!
The material has been provided by InstaForex Company -
www.instaforex.com