Wave pattern of H4 chart:
The dominant trend has been developing since the beginning of the current year and refers to the daily scale of the movement. The last 4-hour section forms the final part.
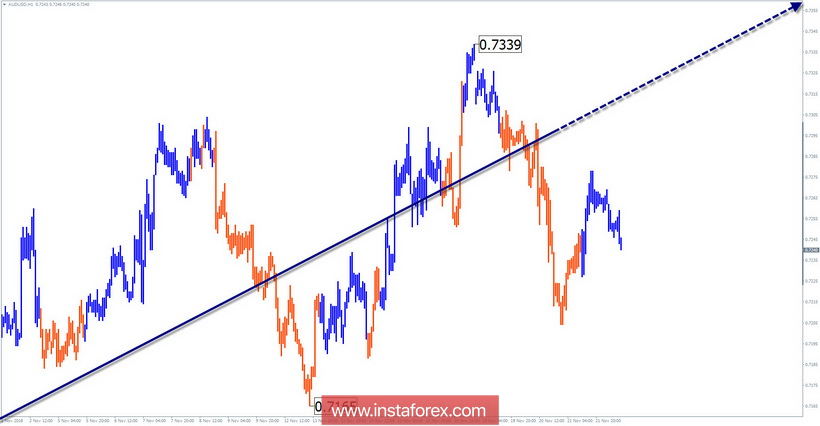
Wave pattern graphics H1:
From the beginning of October, a wave zigzag has been formed towards the main direction. According to its wave level, the area still takes the place of correction of the previous trend segment of the chart.
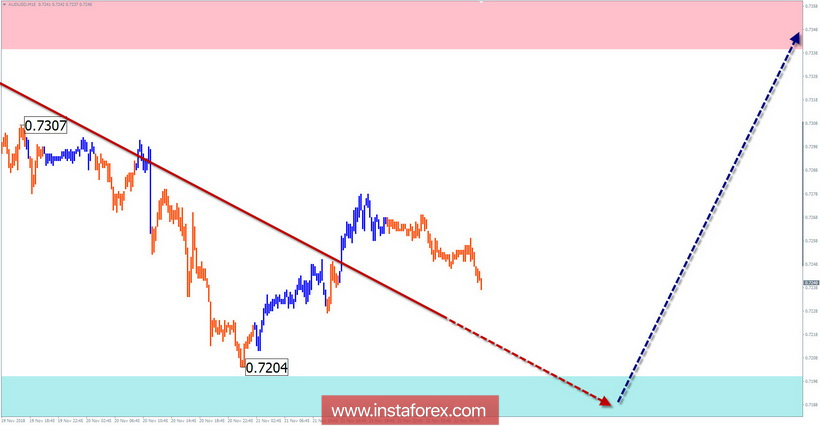
Wave pattern of the M15 chart:
From November 19, a wave that does not have a turning potential develops downwards. From the estimated support, an increase of the re-price is expected.
Recommended trading strategy:
Due to the increased volatility in the side plane, it is better to refrain from trading in the coming week. Within the framework of intraday, short transactions are permissible according to the described algorithm of movement, but it is more reasonable to reduce the lot.
Resistance zone:
- 0.7340/0.7390
Support zone:
- 0.7200/0.7150
Explanation of figures: the simplified wave analysis uses waves consisting of 3 parts (A-B-C). For the analysis, 3 main TFs are used, on each the last, incomplete wave is analyzed. Zones show calculated areas with the highest probability of reversal.
The arrows indicate wave marking according to the method used by the author. With a solid background showing a structure for determining the expected movement.
Note: The wave algorithm does not take into account the duration of the tool movements over time. To conduct a trade, you need to confirm the signals of the trading systems you use!
The material has been provided by InstaForex Company -
www.instaforex.com