Wave pattern on the H4 chart:
The last wave of this scale was completed in mid-August at the upper boundary of the powerful support zone.
Wave pattern on the H1 chart:
A rising wave from August 15 with high potential develops. Over time, the entire movement will move to a higher timeframe. In the wave structure, the middle part (B) is completed.
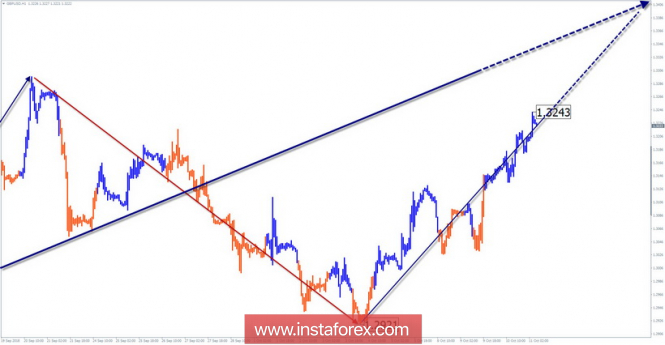
Wave pattern on the M15 chart:
The ascending phase of October 4 gives a start to the final part (C) in the wave. In the coming days, a short rollback is expected.
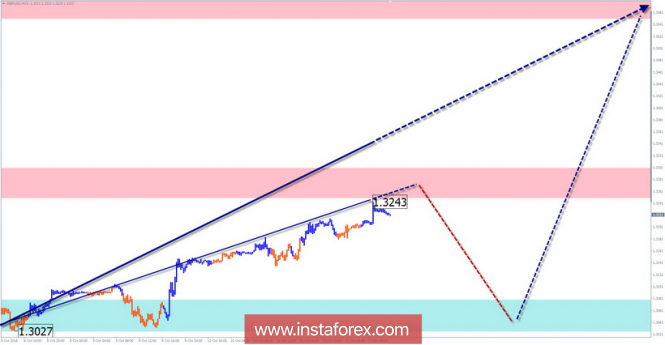
Recommended trading strategy:
Due to the small potential of the upcoming decline, sales are not recommended. In the area of fixation in the support, it is suggested to monitor the instrument purchase signals.
Resistance zones:
- 1.3550 / 1.3600
- 1.3250 / 1.3300
Support areas:
- 1.3080 / 1.3030
Explanations to the figures:
A simplified wave analysis uses a simple waveform, in the form of a 3-part zigzag (A-B-C). Three main timeframes are used for the analysis. The last incomplete wave for every timeframe is analyzed. Zones show the calculated areas with the greatest probability of a reversal.
Arrows indicate the counting of wave according to the technique used by the author. The solid background shows the generated structure and the dotted exhibits the expected wave motion.
Note: The wave algorithm does not take into account the duration of the tool movements in time. To conduct a trade transaction, you need to confirm the signals used by your trading systems.
The material has been provided by InstaForex Company -
www.instaforex.com