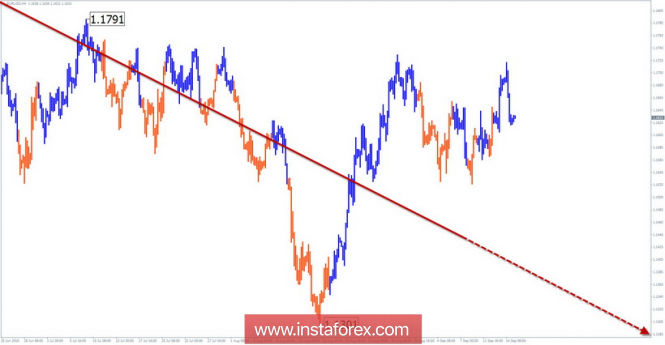
The wave pattern of the H4 chart:
The price of the pair since June 21 moves according to the algorithm of the rising wave. In the daily chart, it formed an incorrect correction type.
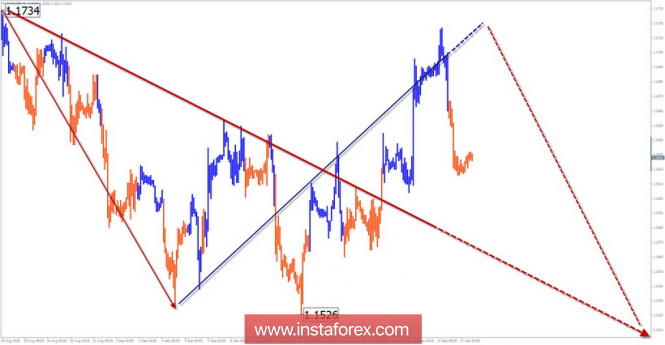
The wave pattern of the H1 chart:
The last hour wave from August 15 completes a larger upward construction. The price has reached the target zone.
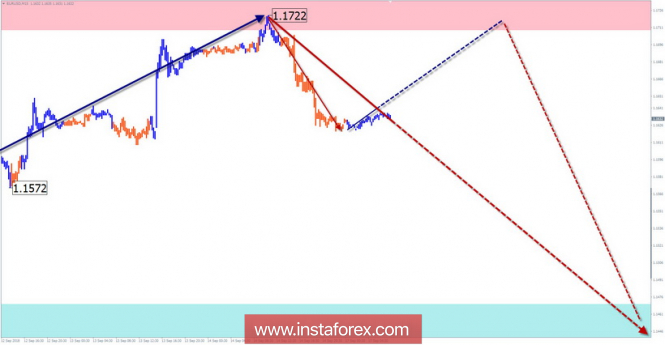
The wave pattern of the M15 chart:
The bearish wave of August 28 continues to create a reversal model of the movement. After the price rise last week, conditions were created for a change in the price movement.
Recommended trading strategy:
There are no conditions for purchases. In the area of calculated resistance, it is recommended to monitor the reversal signals for the sale of the instrument.
Resistance zones:
- 1.1710 / 1.1760
Support zones:
- 1.1470 / 1.1420
Explanations to the figures:
A simplified wave analysis uses a simple waveform, in the form of a 3-part zigzag (ABC). The last incomplete wave for every timeframe is analyzed. Zones show the calculated areas with the greatest probability of a turn.
Arrows indicate the counting of wave according to the technique used by the author. The solid background shows the generated structure and the dotted exhibits the expected wave motion.
Attention: The wave algorithm does not take into account the duration of the tool movements in time. To conduct a trade transaction, you need to confirm the signals used by your trading systems.
The material has been provided by InstaForex Company -
www.instaforex.com