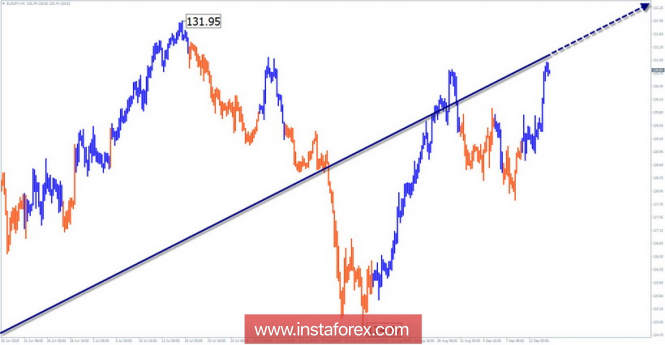
Wave picture of the chart H4:
The direction of the trend is set by the upward wave of May 29. A distinct zigzag (A-B-C) can be traced in the structure.
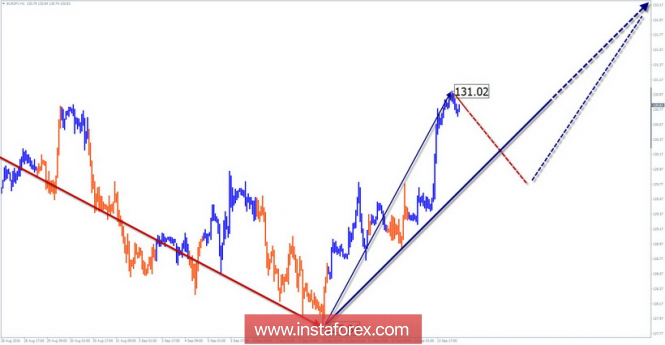
The wave pattern of the graph H1:
The bullish wave of August 13 is approaching a powerful potential reversal zone. The structure of the movement is not complete, but it allows us to wait for a rollback in the near future.
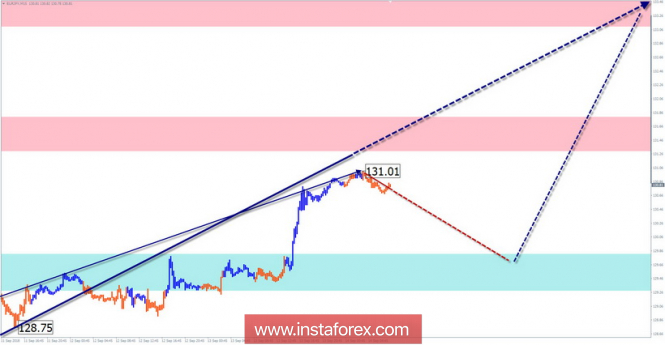
The wave pattern of the M15 chart:
Since September 10, the price forms an ascending segment, occupying the place of the final part (C) in a larger model. Correction is expected in the coming days.
Recommended trading strategy:
Sales of the pair at price retracements are high-risk. For all trading styles at the end of all counter moves, prices are recommended to track buy signals of the pair.
Resistance zones:
- 133.10 / 133.60
- 131.30 / 131.80
Support zones:
- 129.80 / 129.30
Explanations to the figures: In a simplified wave analysis, waves consisting of 3 parts (A-B-C) are used. For analysis, 3 main TFs are used, on each one the last, incomplete wave is analyzed. Zones show the calculated areas with the greatest probability of a turn.
Arrows indicate the wave counting according to the technique used by the author. The solid background shows the generated structure, the dotted - the expected movements.
Attention: The wave algorithm does not take into account the duration of the tool movements in time. To conduct a trade transaction, you need confirmation signals from your trading systems!
The material has been provided by InstaForex Company -
www.instaforex.com