Wave pattern on the H4 chart:
An incomplete wave of this scale forms the last part of the downtrend trend on D1 timeframe.
Wave pattern on the H1 chart:
From September 21, a new downward zigzag wave appears on the chart. A high wave level of movement indicates a transition to a larger scale.
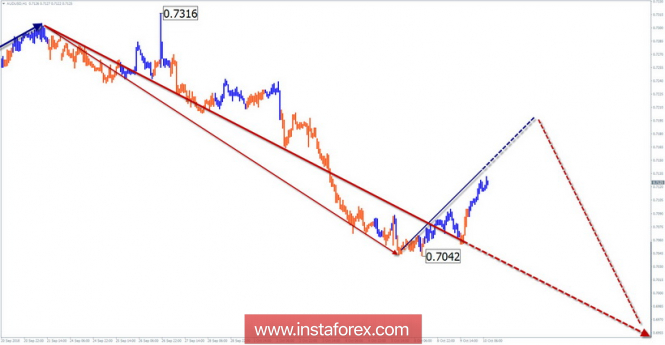
Wave pattern on the M15 chart:
From October 5, the price goes up. In the hourly wave, this area will be a correction.
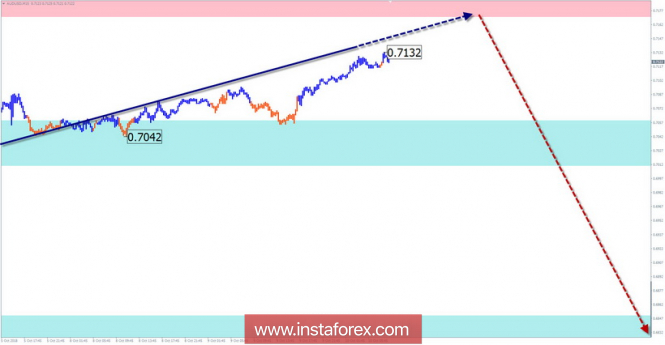
Recommended trading strategy:
The low potential of an increase in the current price of the pair makes purchases risky. In the area of the calculated resistance, it is recommended to track the reversal signals to search for an entry into the short.
Resistance zones:
- 0.7170 / 0.7220
Support areas:
- 0.7060 / 0.7010
- 0.6850 / 0.6870
Explanations to the figures:
A simplified wave analysis uses a simple waveform, in the form of a 3-part zigzag (A-B-C). Three main timeframes are used for the analysis. The last incomplete wave for every timeframe is analyzed. Zones show the calculated areas with the greatest probability of a reversal.
Arrows indicate the counting of wave according to the technique used by the author. The solid background shows the generated structure and the dotted exhibits the expected wave motion.
Note: The wave algorithm does not take into account the duration of the tool movements in time. To conduct a trade transaction, you need to confirm the signals used by your trading systems.
The material has been provided by InstaForex Company -
www.instaforex.com