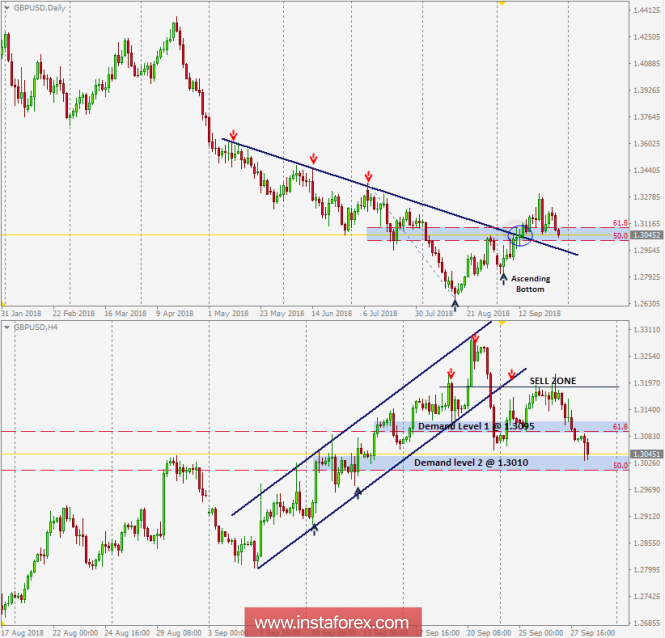
On September 13, the GBP/USD pair was testing the depicted daily downtrend line which came to meet the pair around 1.3025-1.3090. Since then, the pair has been demonstrating a successful bullish breakout so far.
This price zone (1.3025-1.3090) also corresponds to 50% and 61.8% Fibonacci levels. Currently, this price zone turned to become a prominent demand zone to be watched for bullish price action.
However, on H4 chart, the market failed to maintain its uptrend within the depicted bullish channel on H4 chart. The lower limit of the depicted channel (which came to meet the GBP/USD pair around 1.3190) failed to offer sufficient bullish demand.
As expected, the price level of 1.3190 offered significant bearish rejection (the backside of the broken bullish channel).
Therefore, the GBP/USD short-term outlook turned to become bearish towards 1.3010 (50% Fibonacci level) where price action should be watched.
Moreover, any decline below 1.3010 (50% Fibo level) will probably invalidate the DAILY bullish scenario for the short-term. Hence, the pair would have short-term bearish targets around 1.2960 and 1.2900.
The material has been provided by InstaForex Company -
www.instaforex.com