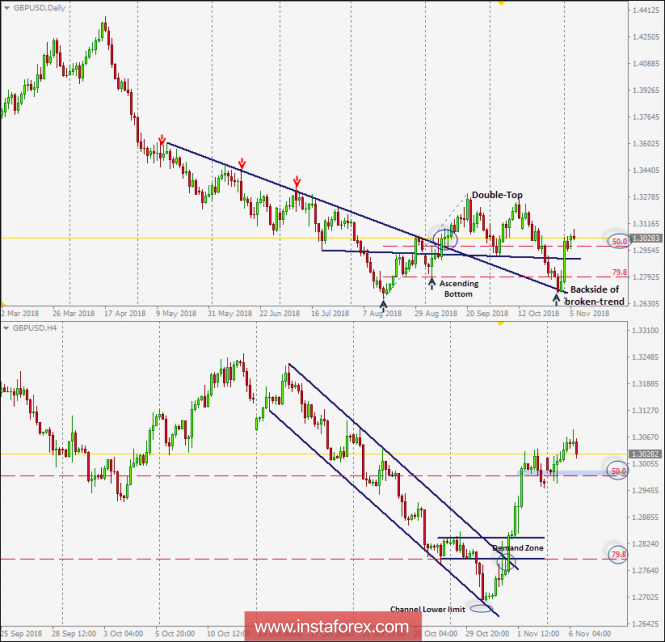
Since September 13, the GBP/USD pair has been demonstrating a successful bullish breakout above the depicted daily downtrend line which came to meet the pair around 1.3025-1.3090.
On September 21, the GBP/USD pair failed to demonstrate sufficient bullish momentum above 1.3296. The short-term outlook turned to become bearish within the depicted H4 bearish channel to test the backside of the broken uptrend.
Bearish persistence below the price level of 1.2970 (50% Fibo level) enhanced further bearish decline towards 1.2790 then 1.2700 where the lower limit of the movement channel and 79.8% Fibonacci Level were located.
On H4 chart, the GBP/USD pair looked oversold around the price levels of 1.2700. BUY entries were suggested around the lower limit of the depicted H4 channel (1.2700).
As for the bullish DAILY breakout scenario to remain valid, quick bullish breakout above 1.3000 (50% Fibo level) was achieved by the end of last week's consolidations.
Bullish persistence above the price zone of 1.2970-1.3000 (50% Fibonacci zone) allows more bullish advancement towards (1.3130) and (1.3200).
On the other hand, bearish breakout below 1.2970 (50% Fibo level) enhances further bearish decline towards 1.2790 and 1.2660.
Trade Recommendations:
Conservative traders can wait for bearish pullback towards 1.2970-1.3000 for a low-risk BUY entry.
T/P levels to be located around 1.3130 and 1.3200. S/L should be set as daily candlestick closure below 1.2970.
The material has been provided by InstaForex Company -
www.instaforex.com