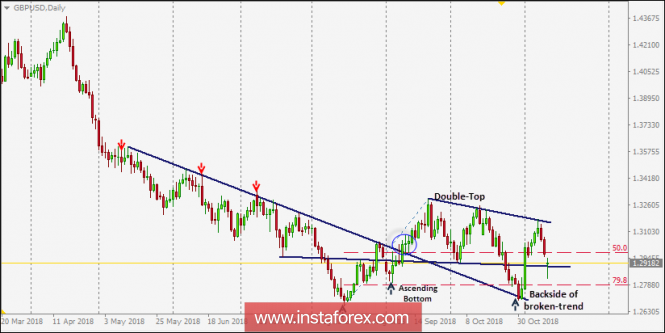
Since September 13, the GBP/USD pair has been demonstrating a successful bullish breakout above the depicted daily downtrend line which came to meet the pair around 1.3025-1.3090.
On September 21, the GBP/USD failed to demonstrate sufficient bullish momentum above 1.3296. The short-term outlook turned to become bearish to test the backside of the broken uptrend.
On H4 chart, the GBP/USD pair looked oversold around the price levels of 1.2700. BUY entries were suggested around (1.2700).
As for the bullish DAILY breakout scenario to remain valid, quick bullish breakout above 1.3000 (50% Fibo level) was achieved two weeks ago.
This enhanced further bullish advance towards the price level of 1.3170-1.3200 where the depicted downtrend came to meet the GBP/USD pair.
Last week, signs of bearish rejection were demonstrated around the price zone of 1.3170-1.3200 (the depicted downtrend). This initiated the current bearish pullback. The initial bearish target was already reached around 1.2900.
Currently, the price zone of (1.2900-1.2850) now constitutes a prominent demand zone corresponding to the backside of the depicted trend line.
Conservative traders can have a valid BUY entry around the current price levels. T/P levels should be located around 1.2970 and 1.3100.
The material has been provided by InstaForex Company -
www.instaforex.com