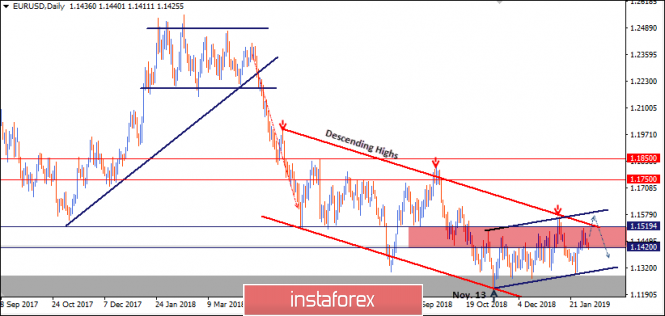
Since June 2018, the EUR/USD pair has been moving sideways with slight bearish tendency within the depicted bearish Channel (In RED).
On November 13, the EUR/USD pair demonstrated recent bullish recovery around 1.1220-1.1250 where the current bullish movement above the depicted short-term bullish channel (In BLUE) was initiated.
Bullish fixation above 1.1420 was needed to enhance further bullish movement towards 1.1520.
However, the market has been demonstrating obvious bearish rejection around 1.1420 few times until January 28 when the daily candlestick achieved a bullish closure above 1.1420.
A further bullish advance was expected towards the price level of 1.1550 where the upper limit of both depicted channels (RED & BLUE) was located.
Around 1.1550-1.1570, there's a confluence of supply levels (upper limit of channels & previous historical bottoms) where bearish rejection as well as a valid SELL entry would be expected.
However, the EUR/USD pair has lost its bullish momentum since Thursday when a bearish engulfing candlestick was demonstrated around 1.1514. Thus, another descending high was established then.
Hence, any bearish closure below 1.1420 terminates the current bullish movement (initiated on January 25) allowing another bearish visit towards 1.1350 and 1.1300.
Trade Recommendations:
Conservative traders should wait for the current bullish pullback to pursue towards the price level of 1.1550-1.1570 for a valid SELL entry. T/P levels to be located around 1.1420 and 1.1300. S/L to be located above 1.1600.
Risky traders SELL the GBP/USD pair upon a bearish H4 candlestick closure below 1.1400. T/P to be located around 1.1350 and 1.1285.
The material has been provided by InstaForex Company -
www.instaforex.com