Trend analysis (Figure 1).
The price in October will try again to break through the sliding line of 38.2% - 1.1780 (blue dashed line), which means that the closest target when moving up will be at this level.
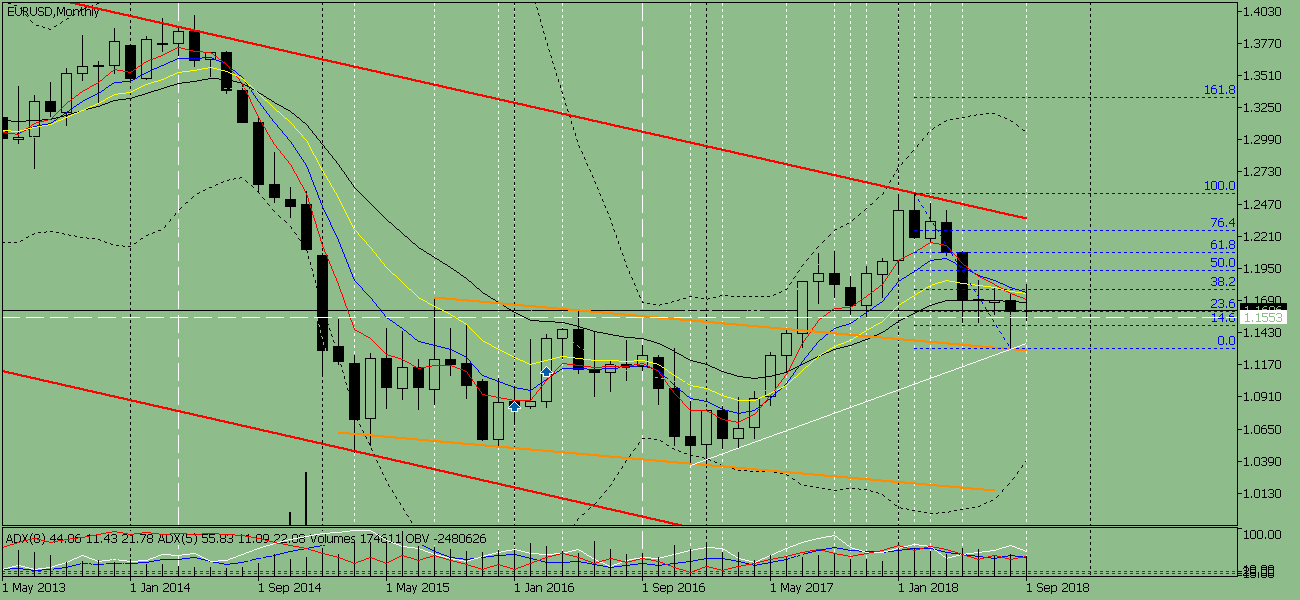
Fig. 2 (monthly schedule).
Comprehensive analysis:
- Indicator analysis - up;
- Fibonacci levels - up;
- Volumes - up;
- Candlestick analysis - up;
- Trend analysis - up;
- Bollinger lines - down;
The conclusion of the complex analysis is most likely the top job.
The total result of the calculation of the EUR / USD currency pair candle on a monthly schedule: the price is most likely to have an upward trend with the absence of the first lower shadow (the first week of the month is the lower) for the monthly white candle and the second upper shadow (the last week is black).
The first upper target is a rollback level of 38.2% 1.1780 (blue dashed line).
The material has been provided by InstaForex Company -
www.instaforex.com