4-hour timeframe
The amplitude of the last 5 days (high-low): 120п – 119п – 105p – 117п – 79п.
The average amplitude over the past 5 days: 108p (112p).
The British pound also continues its upward movement. In addition to all the reasons for the fall of the US dollar listed in the EUR/USD article, the British pound is growing on market expectations of a favorable outcome of negotiations on Brexit. Moreover, there are few special grounds for assuming such an outcome. Nevertheless, the pound is growing, and the morning attempt to start a downward correction ended in failure. Nevertheless, the correction can still begin today or tomorrow, as the MACD indicator is preparing to turn downwards, and the pound can not grow forever on the same rumors. We need a new piece of "insider" information or official information about the progress in the negotiations. As for the greenback, in addition to the collapse in the stock market, a whole group of factors does not allow the US currency to show growth. Even yesterday's failed GDP report for August in the UK did not have any negative impact on the pair. As a result, we can currently expect only a purely technical correction, which can be determined by the MACD turn down. On the last trading day of the week, the correction can develop, as important macroeconomic events are not planned for this day, and traders can begin to lock in positions on the longs that they have increased throughout the trading week. And next week we will expect official information on the Brexit negotiations, as the deadline is approaching.
Trading recommendations:
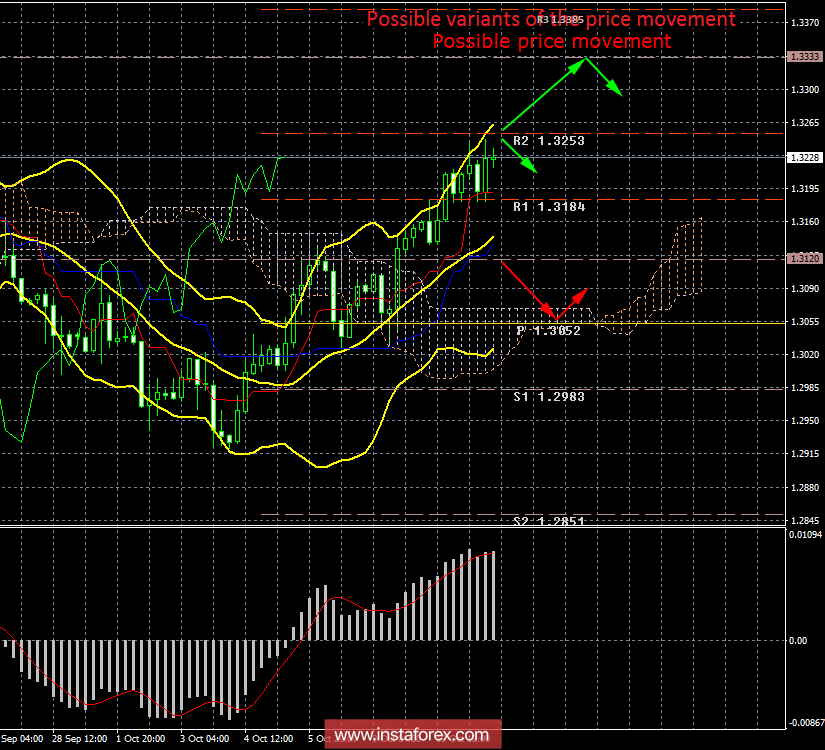
The GBP/USD pair continues its upward movement and has almost reached the second resistance level of 1.3253. The price rebound from this target or a reversal of the MACD indicator downwards will serve as a signal to close longs – a correction is brewing.
It is recommended to open sell positions in small lots if traders manage to overcome the critical Kijun-sen line. In this case, the first target for the downward movement will be the Senkou Span B.
In addition to the technical picture, you should also consider the fundamental data and the time of their release.
Explanation of the illustration:
Ichimoku indicator:
Tenkan-sen - the red line.
Kijun-sen - the blue line.
Senkou Span A - light brown dotted line.
Senkou Span B - light purple dotted line.
Chikou Span - green line.
Bollinger Bands indicator:
3 yellow lines.
MACD Indicator:
Red line and histogram with white bars in the indicator window.
The material has been provided by InstaForex Company -
www.instaforex.com