4-hour timeframe
The amplitude of the last 5 days (high-low): 79п – 66п – 70п – 71p – 65п.
The average amplitude over the past 5 days: 70P (83P).
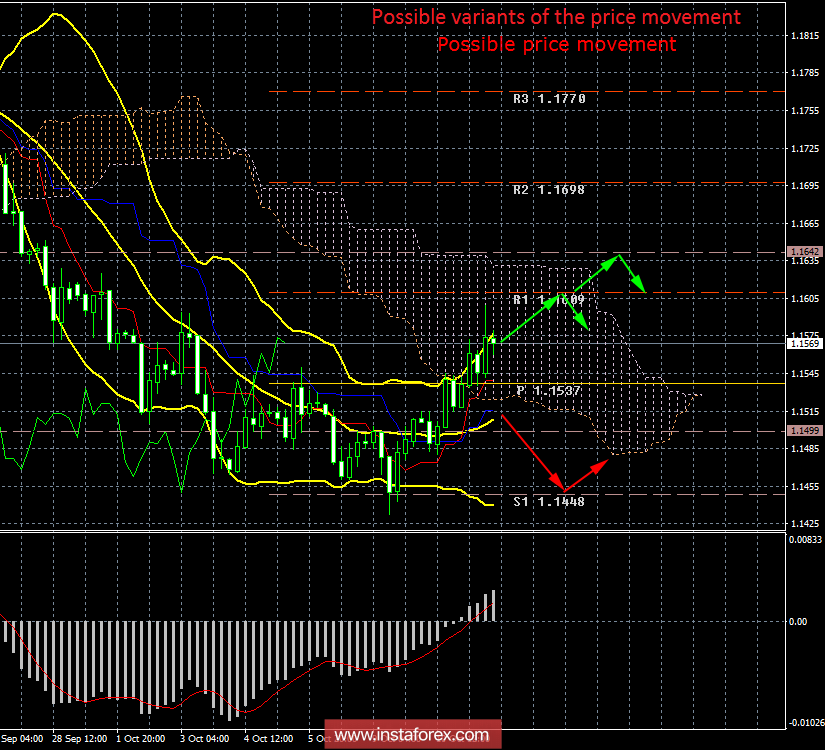
On Thursday, October 11, the main topic of discussion is the collapse of the US stock market. However, we believe that the collapse of the dollar has so far had a very indirect effect. First, the US dollar is declining for the second day in a row, after it sharply strengthened. Thus, this growth of the US currency falls under the banal definition of a "correction". Secondly, there is no panic in the currency market. Third, today there was a particular factor which the fall of the US currency in the form of a weak report on the consumer price index, which slowed from 2.7% to 2.3% in annual terms. Thus, we believe that there is no link, or little, between the decline in the US stock market and the fall in the dollar. Based on this, we should not expect a further decline in the US currency, based only on expectations of a fall in the stock market. From a technical point of view, the pair may continue to move up to the levels of 1,1609 and 1,1642. Next, the pair is faced with a test in the form of overcoming the strong line of the Ichimoku indicator - Senkou Span B. It should be remembered that the current upward movement is a correction, despite the formation of the"Golden cross". Fourth, Donald Trump again lashed out at the Federal Reserve, which, in his opinion, does not allow the US economy to develop. Fifth, information on the possible introduction of new trade sanctions against China is again being discussed, as well as accusations against Beijing in regards to currency manipulation of the yuan exchange rate. All these factors should and have a negative impact on the dollar.
Trading recommendations:
For the EUR/USD pair, the price continues to move up. Thus, longs with targets of 1.1609 currently remain relevant. A turn of the MACD indicator downwards will signal at least a correction and will serve as a signal to reduce long positions.
Orders for selling can be viewed only after the pair is re-consolidated below the Kijun-Sen line. In this case, the downward trend will resume with the aim of the support level of 1.1448.
In addition to the technical picture, you should also consider the fundamental data and the time of their release.
Explanation of the illustration:
Ichimoku indicator:
Tenkan-sen - the red line.
Kijun-sen - the blue line.
Senkou Span A - light brown dotted line.
Senkou Span B - light purple dotted line.
Chikou Span - green line.
Bollinger Bands indicator:
3 yellow lines.
MACD Indicator:
Red line and histogram with white bars in the indicator window.
The material has been provided by InstaForex Company -
www.instaforex.com