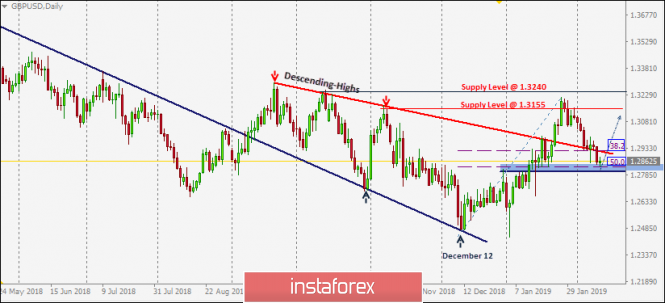
On December 12, the previously-dominating bearish momentum came to an end when the GBP/USD pair visited the price levels of 1.2500 where the backside of the broken daily uptrend was located.
Since then, the current bullish swing has been taking place until January 28 when the GBP/USD pair was almost approaching the supply level of 1.3240.
That's when the current bearish pullback was initiated around slightly lower price levels near 1.3215 (around the depicted supply levels in RED).
This was followed by a bearish engulfing daily candlestick on January 29. Thus, the GBP/USD pair lost its bullish persistence above 1.3155 as a result.
As expected, the recent bearish decline below 1.3150 brought the GBP/USD pair into a deeper bearish correction towards 1.2920-1.2950 where (38.2% Fibonacci level) as well as the backside of the depicted broken trend are located (in RED).
However, lack of bullish demand was demonstrated on yesterday's daily candlestick. Hence, the short-term scenario turned bearish towards 1.2800 where bullish recovery is expected to be demonstrated.
For the bullish side to regain dominance, a bullish breakout above 1.2920 (38.2% Fibonacci) should be re-established early.
Trade Recommendations:
Conservative traders can consider the recent decline towards 1.2825-1.2800 as a valid BUY entry. S/L to be located below 1.2760. T/P levels to be located at 1.2890 and 1.3040.
The material has been provided by InstaForex Company -
www.instaforex.com