Technical market overview:
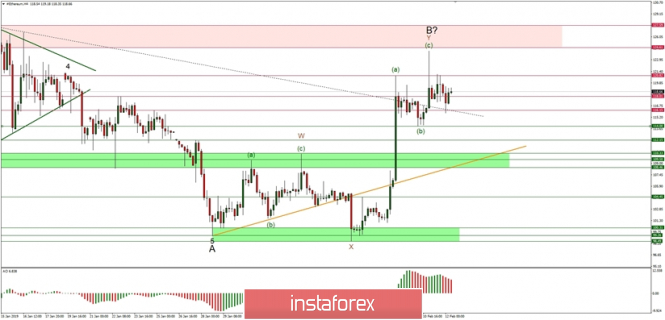
The ETH/USD pair has been trading in a tight consolidation zone located between the levels of 116 - 120 USD after the swing high at the level of 124 USD was made. This high might be considered at the top for wave B, but it has not been confirmed yet. The top confirmation will be possible when the price will break below the key technical support zone of 108.46 - 110.33 USD.
Please notice the bearish divergence between the price and the momentum indicator that support the short-term bearish outlook. The nearest technical support is seen at the level of 114 USD and 112.15 USD.
Weekly Pivot Points:
WR3 - 149.94
WR2 - 135.39
WR1 - 127.42
Weekly Pivot - 112.16
WS1 - 105.12
WS2 - 90.45
WS3 - 82.23
Trading recommendations:
Only the sell orders should be opened as close as possible to the level of 120.81 - 124.10 with a protective stop loss placed above the level of 124.61. The target is technical support at the level of 112.15 and 110.33.
The material has been provided by InstaForex Company -
www.instaforex.com