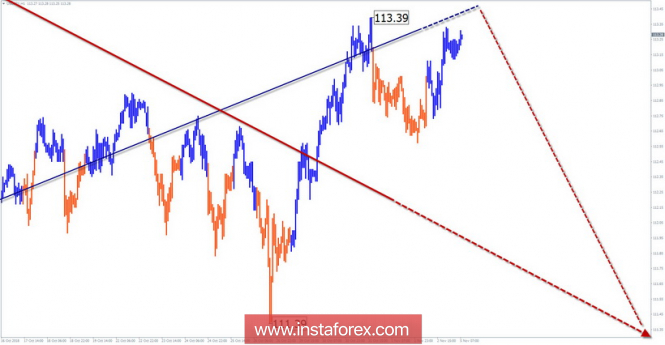
Wave pattern graphics H4:
On the beginning of June 19, the bearish wave forms a stretched plane on the graph. In the daytime wave, this section became a correction (B).This section has become a correction (B).
Wave pattern graphics H1:
Wave design from October 3 forms a downward zigzag. The wave lacks the final part (C).
Wave pattern graphics M15:
The rising wave of October 26 completes the larger bullish pattern, which has formed the "expanding triangle" figure on the chart.
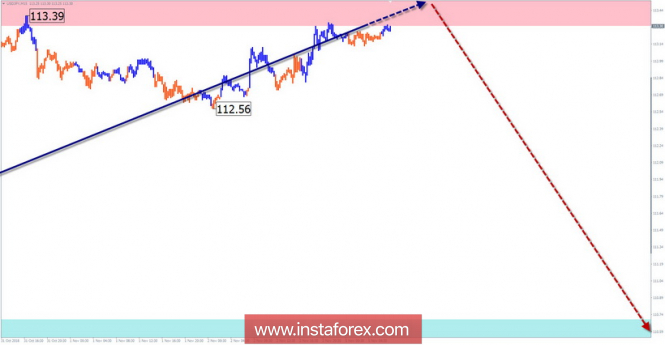
Recommended trading strategy:
The expected potential for decline in the region of 3 price figures allow traders to sell the pair in the near future. Supporters of trade in large segments of the schedule need to wait for the completion of the entire current wave.
Resistance zones:
- 113.30 / 113.80
Support areas:
- 110.70 / 110.20
Explanations to the figures: The simplified waveform analysis uses waves consisting of 3 parts (A - B - C). For the analysis, 3 main TFs are used. On each of the last, incomplete wave is analyzed. Zones show calculated areas with highest probability of reversal.
The arrows indicate the number of wave markings by the method used by the author. The solid background shows the formed structure, the dotted - the expected movement
Note: The wave algorithm doesn't take into account the duration of tool movements over time. To conduct a trade transaction, you need confirmation signals from the trading systems you use.
The material has been provided by InstaForex Company -
www.instaforex.com